Let's talk trash.
Overview
The project involves identifying a timely subject matter, gathering pertinent secondary research data and insights, and crafting a captivating narrative centered around the chosen theme by employing sophisticated data visualization techniques such as charts, graphs, and infographics.
Our team opted to address the waste management system in New York State. Over a rigorous two-week period, we conducted extensive statistics and data-driven research, which played a pivotal role in shaping our narrative on this subject matter.
Role
Researcher | Data Visualizer
Duration
4 Weeks (2023)
Team
3 Students


My role as a data visualizer
While my primary focus in this project centered on crafting data visualizations, I provided comprehensive support to my team members through secondary research tasks.
Collaborating closely with a fellow visual designer and researcher, I contributed to the development of impactful slides and posters that effectively communicated the substantial subject matter at hand.
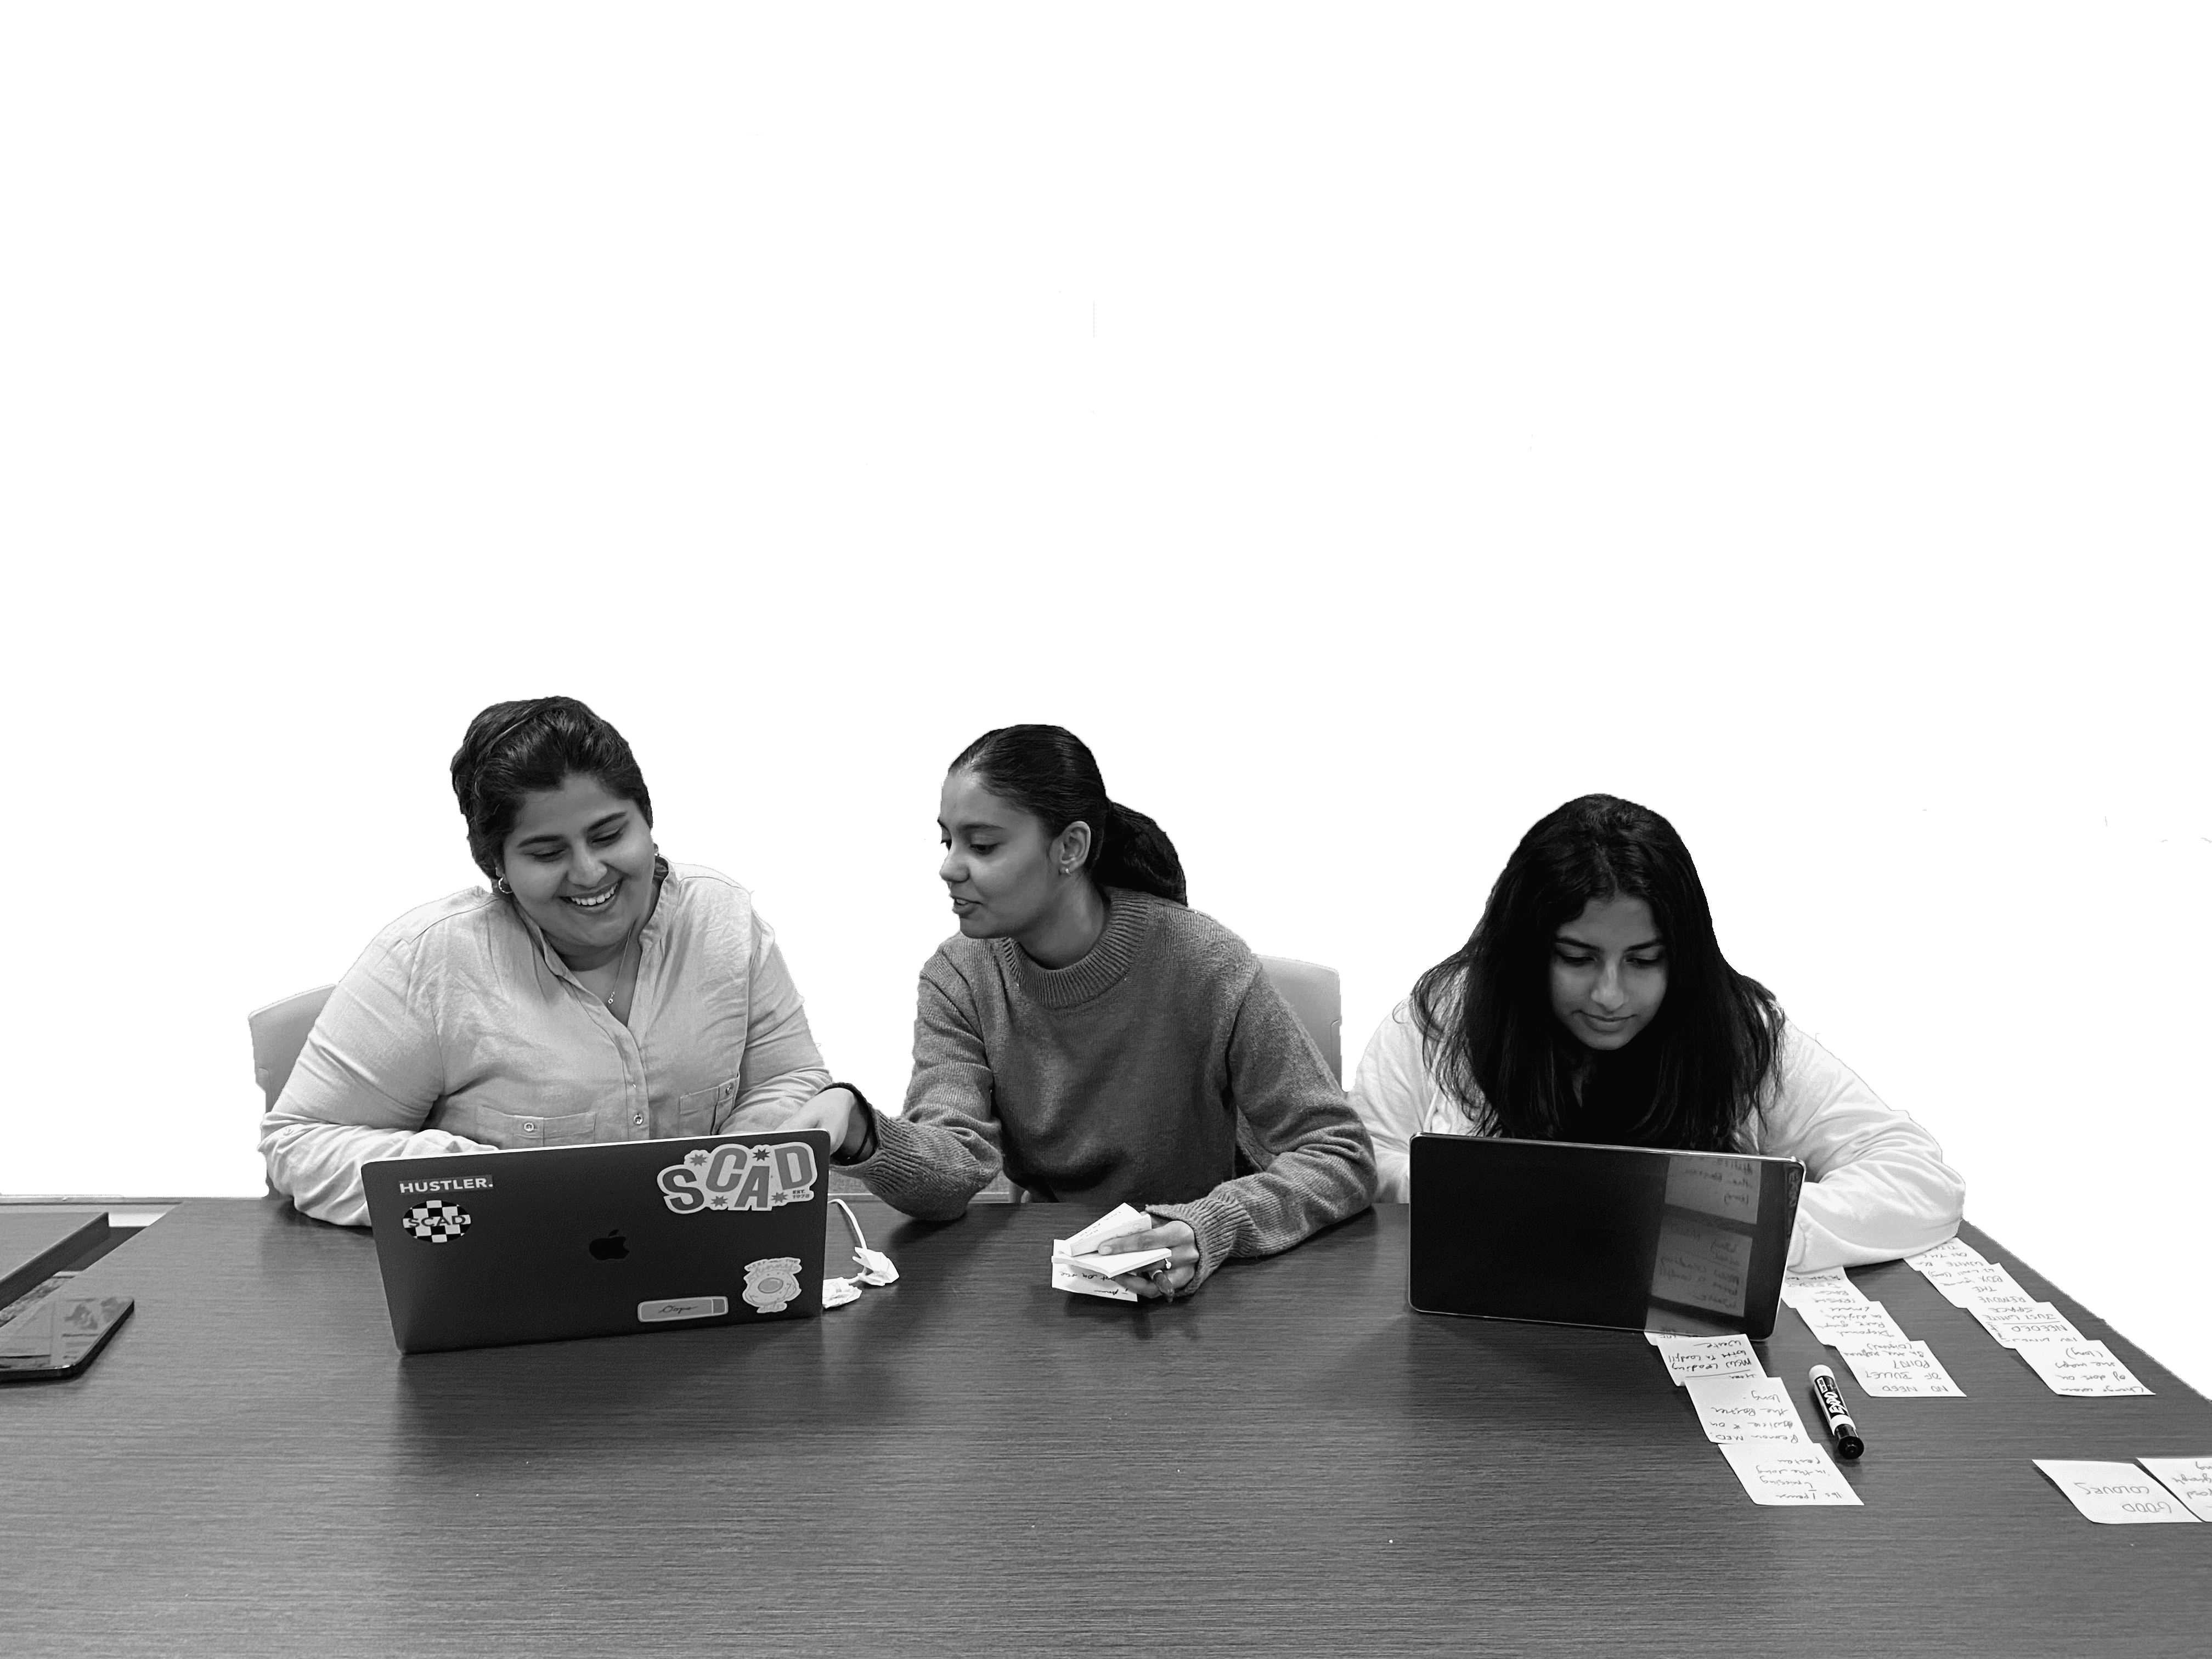
Research, brainstorming, and data visualization
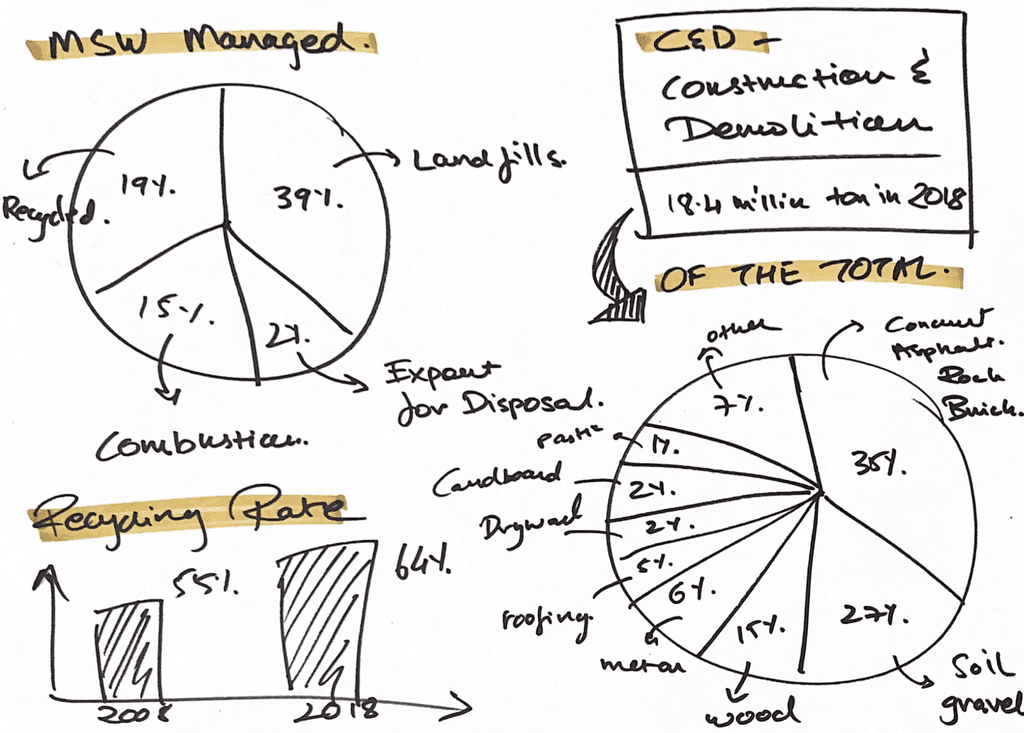
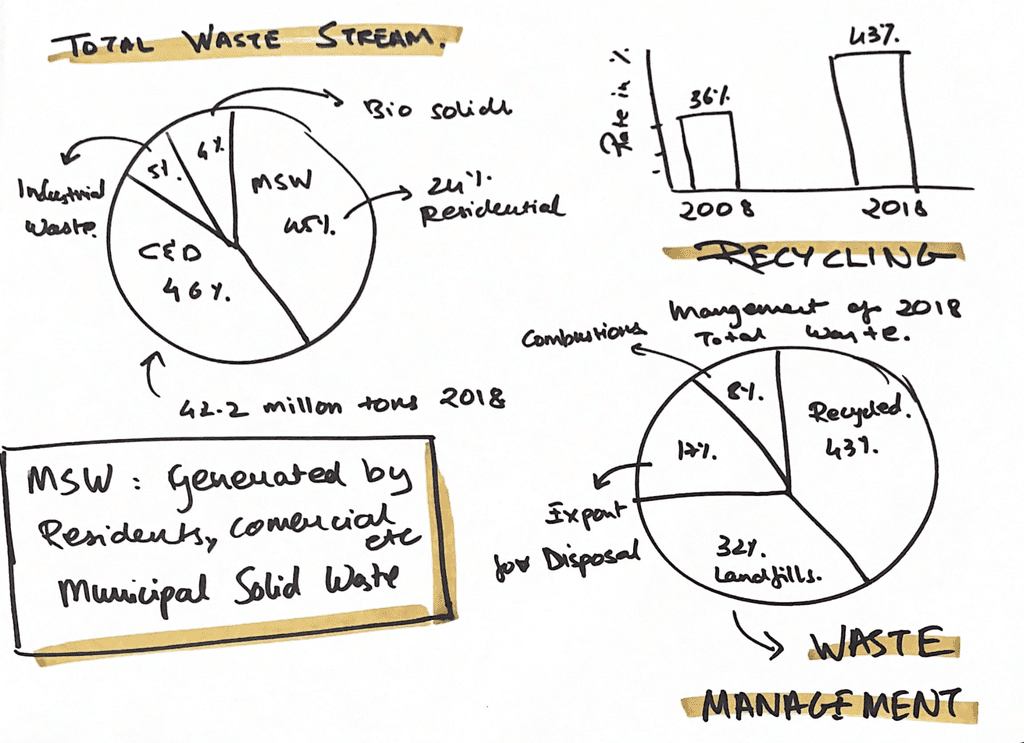
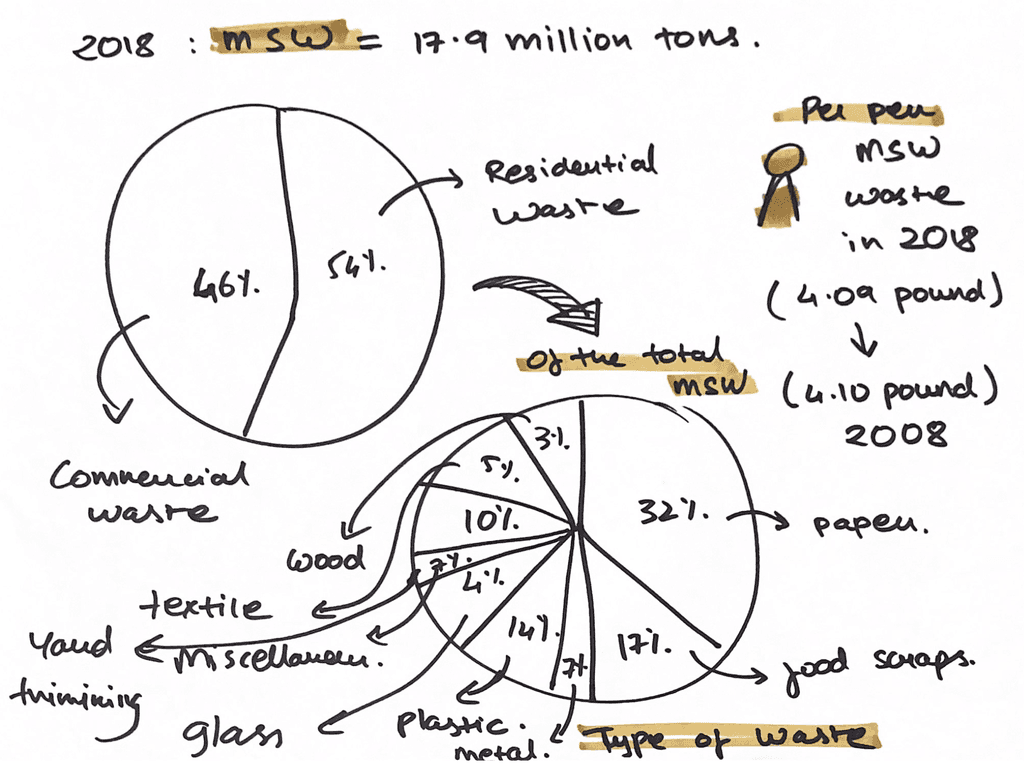
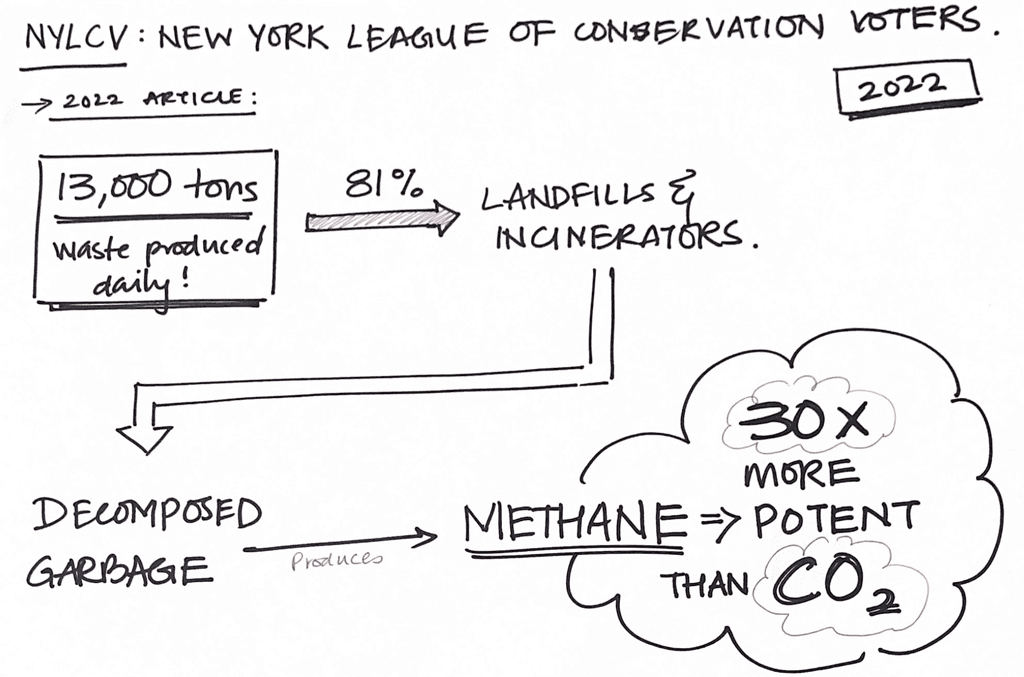
Given the intensity of the topic - waste management in New York State - we were able to collect a wide range of data and statistics for this project. Sticky notes, markers, and the whiteboard were our partners-in-crime to help draft the narrative of our story.
Crafting the story
Our entire data was compiled and narrated through a deck that showcased our ability to re-create our secondary research into visually captivating charts, graphs, and maps.

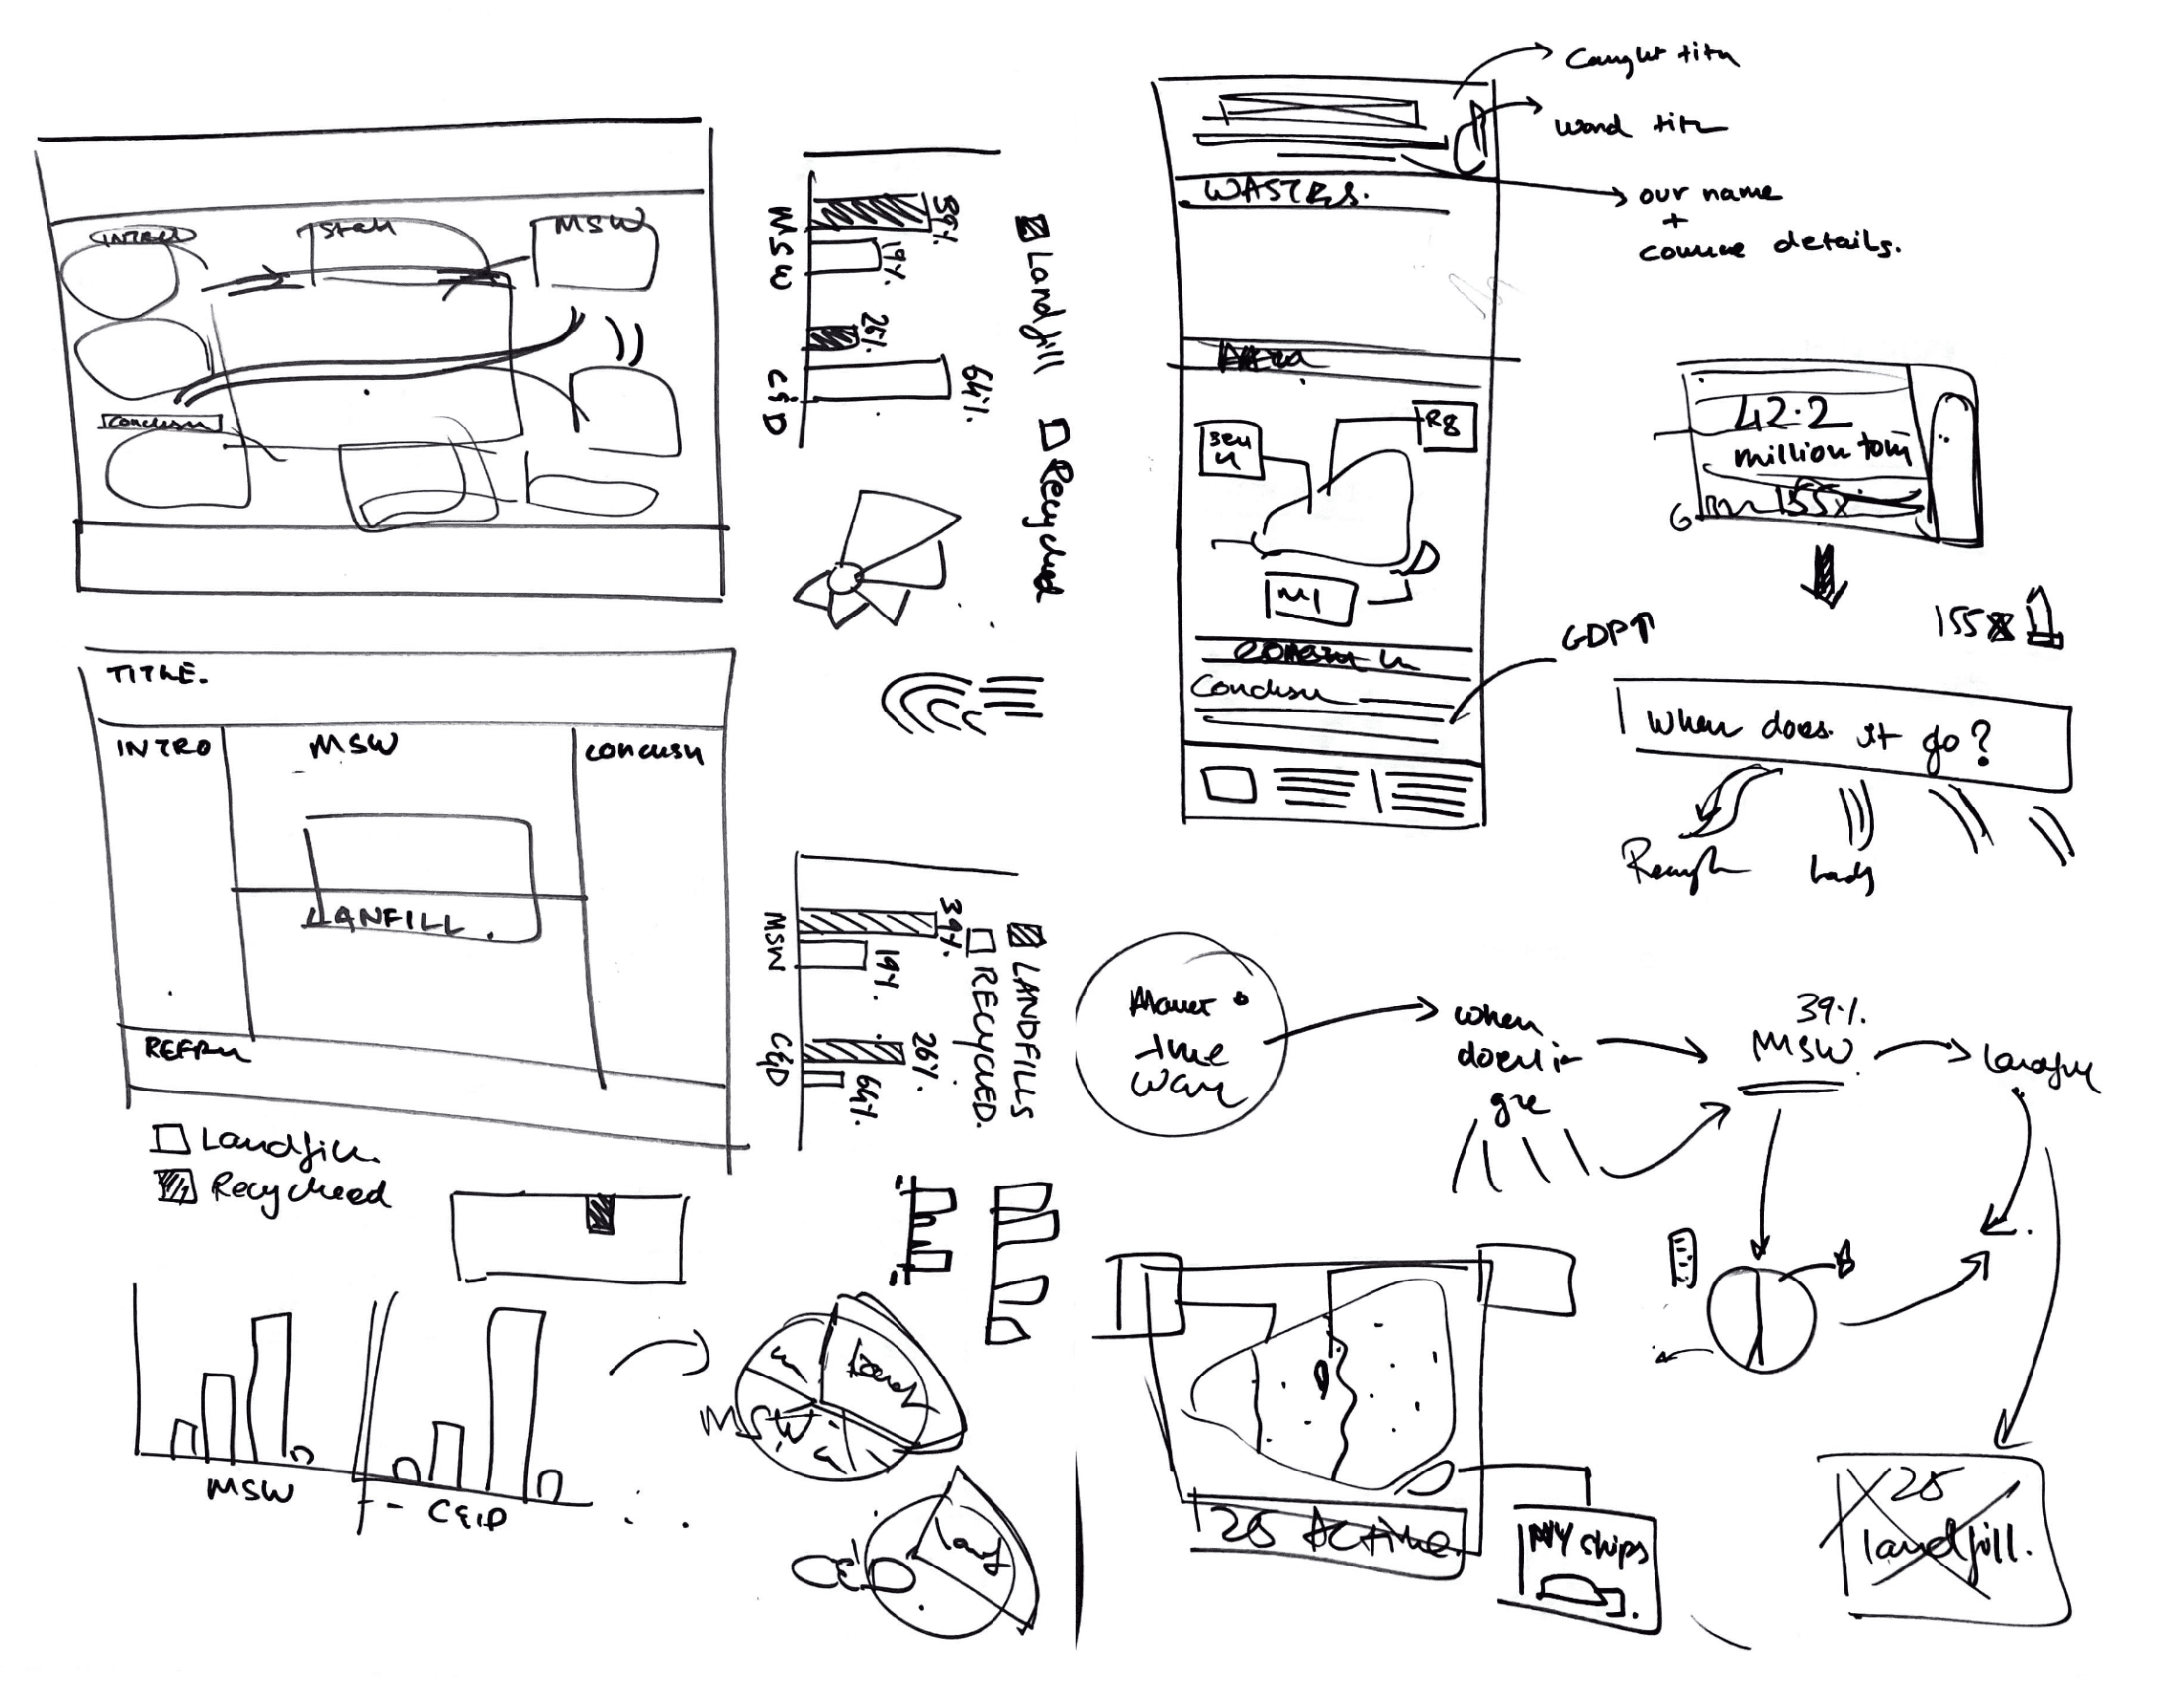
RAPID SKETCHING
DATA SYNTHESIS
INSIGHT TRANSLATION
Single narrative print poster
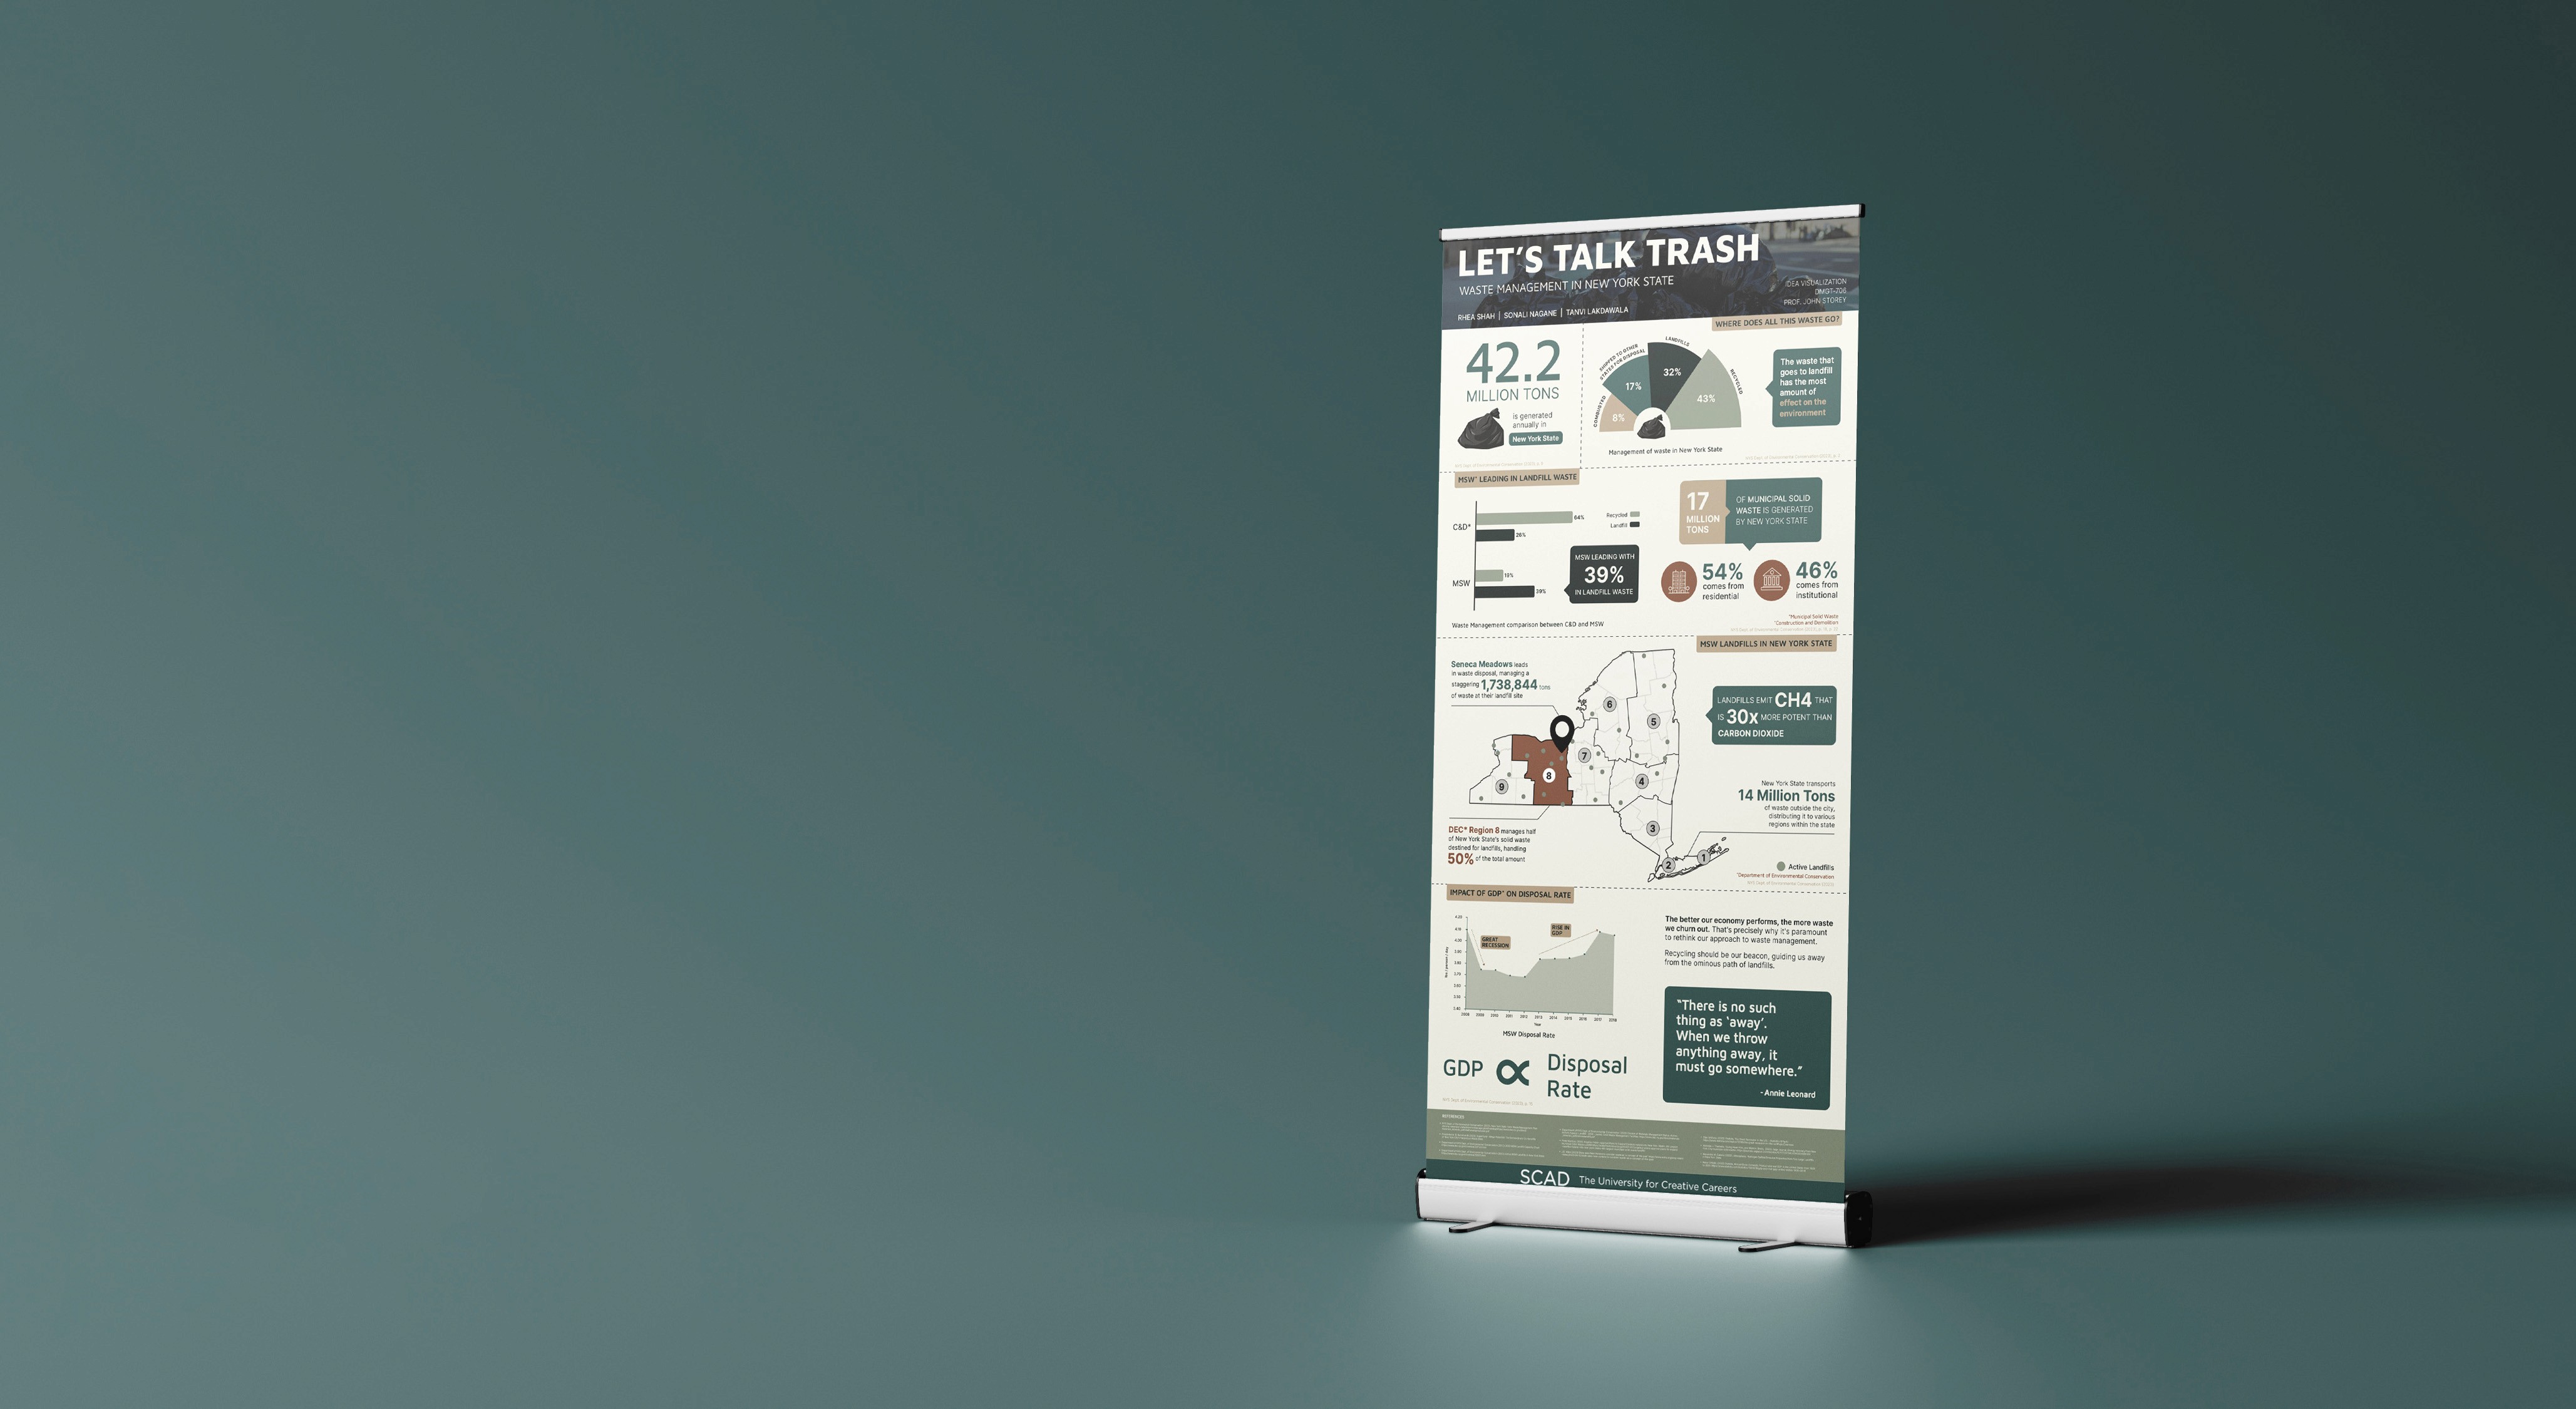
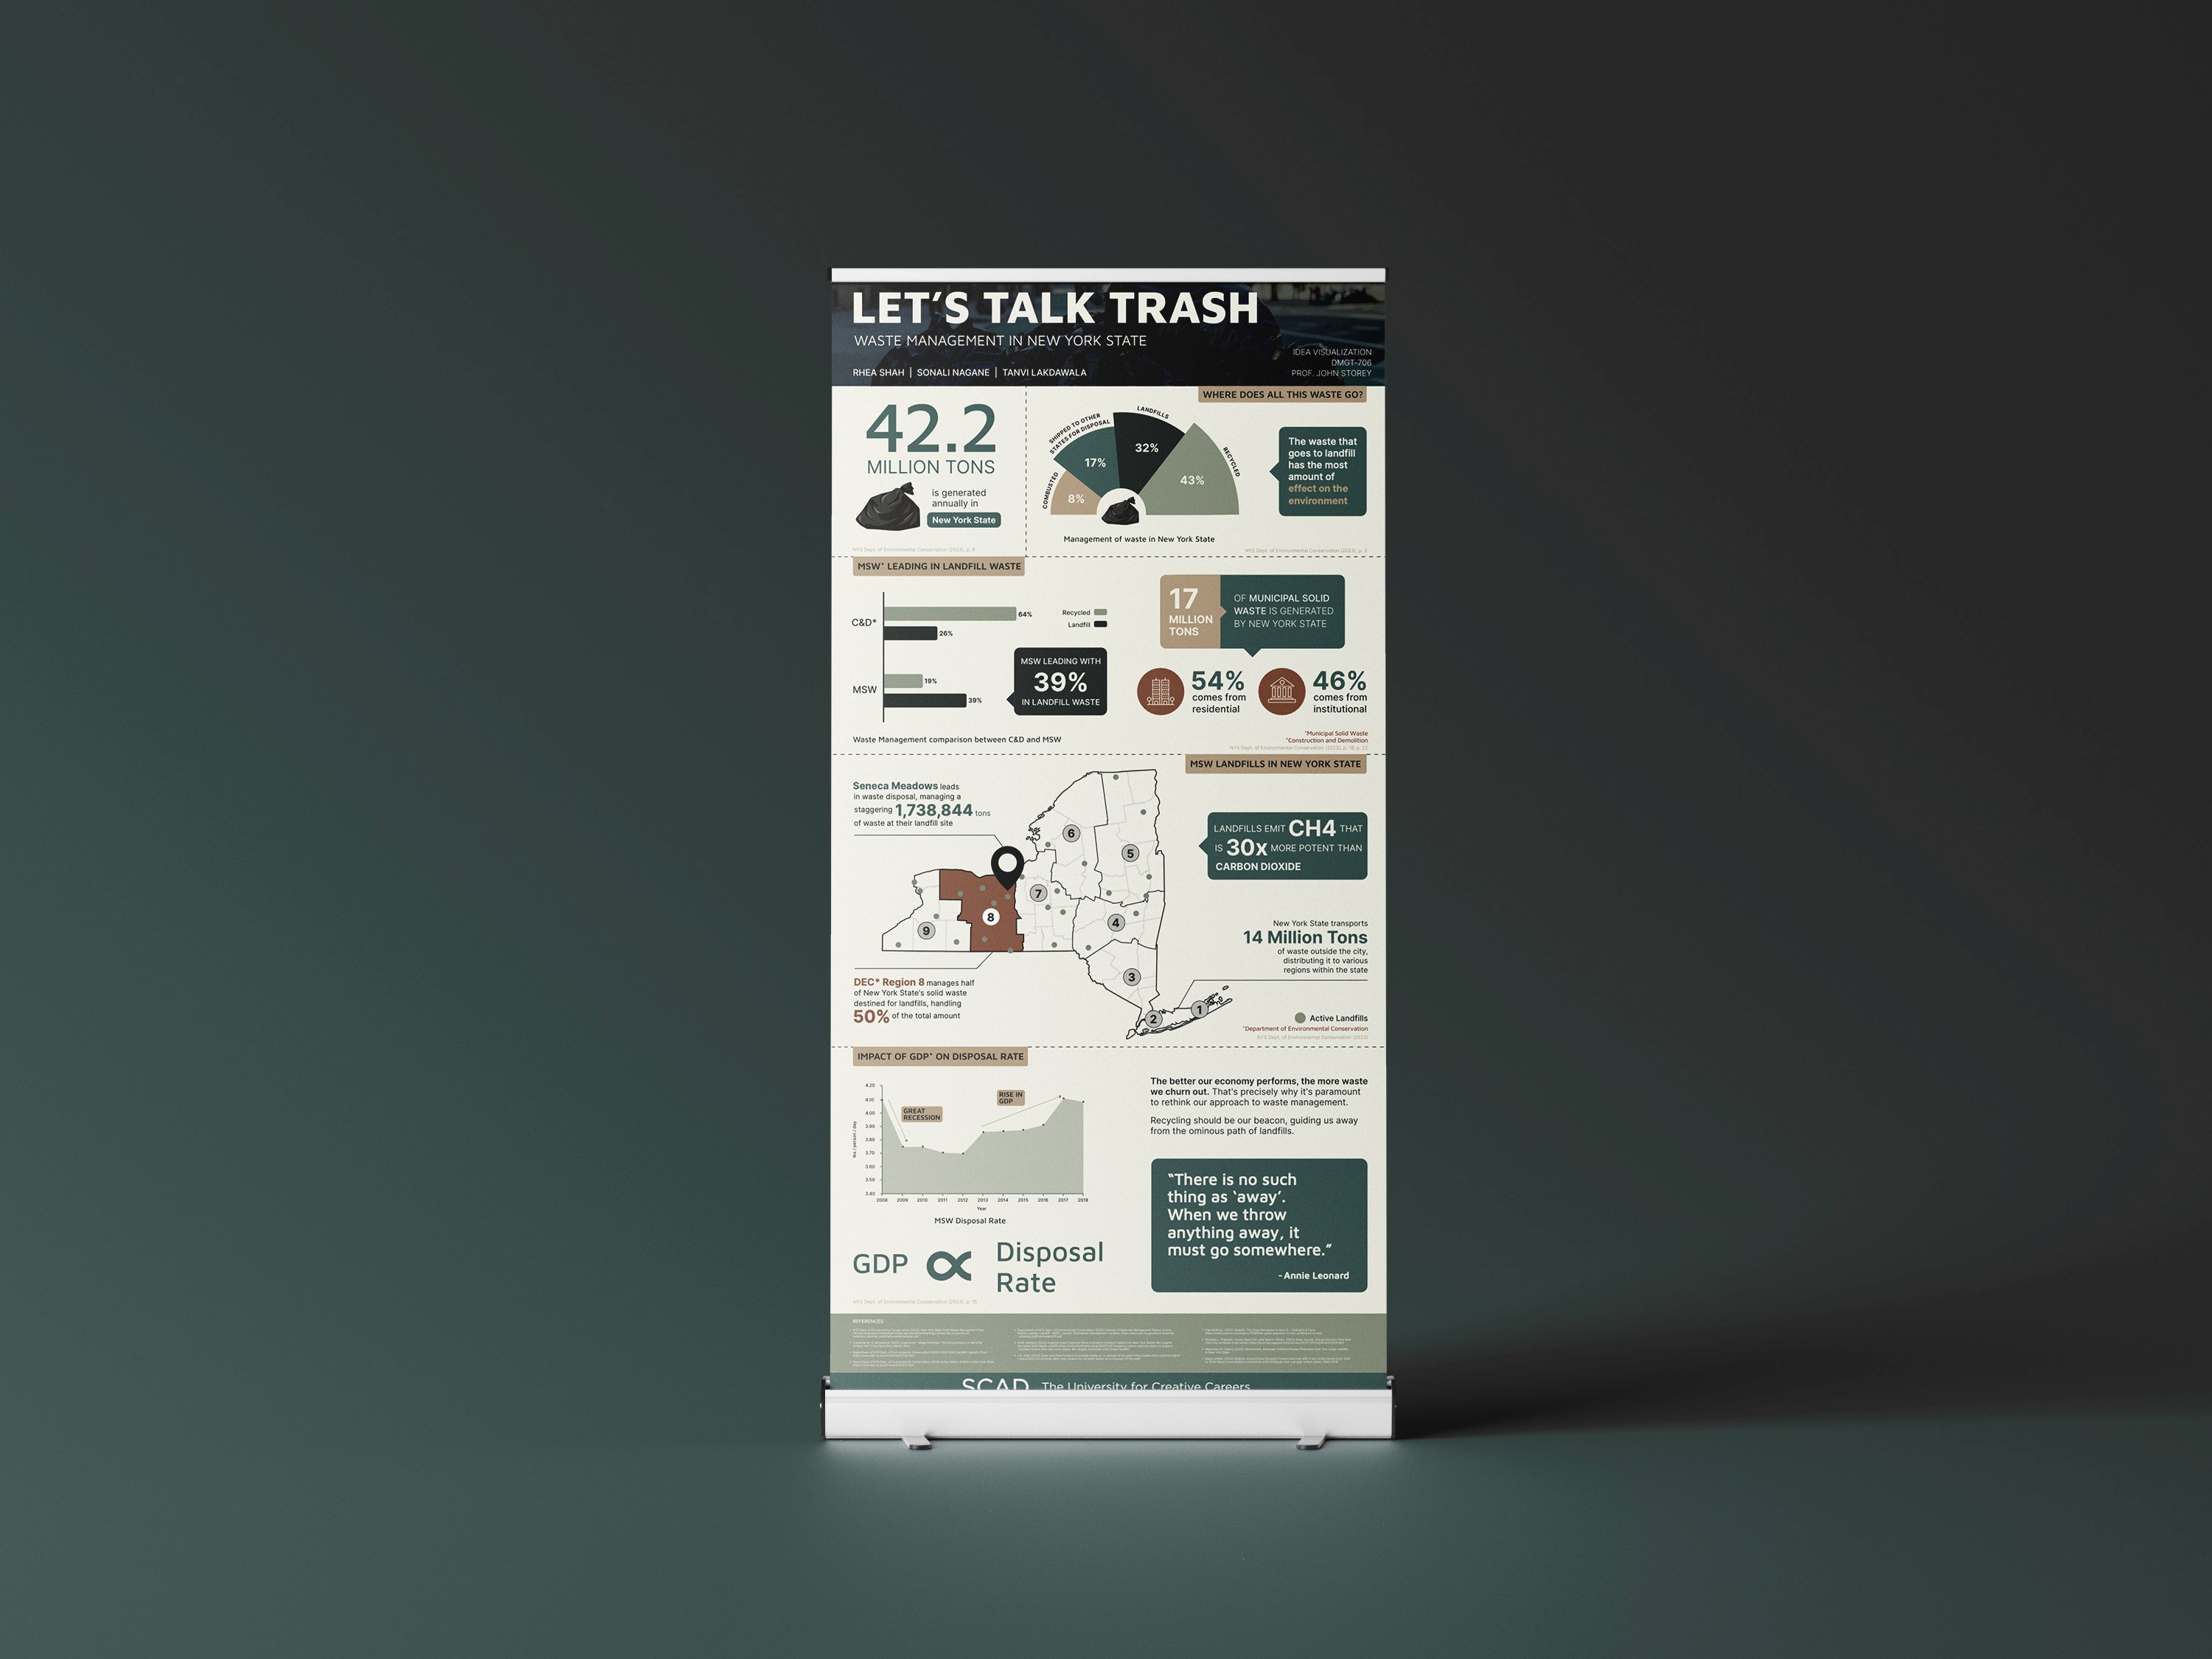
Utilizing the findings and insights from our comprehensive research, we crafted a conference poster. The design was structured to feature a coherent layout, seamless flow, and harmonious composition, adeptly communicating our narrative through data visualization.
A variety of charts, call-outs, and graphs were designed best suited for each data point.
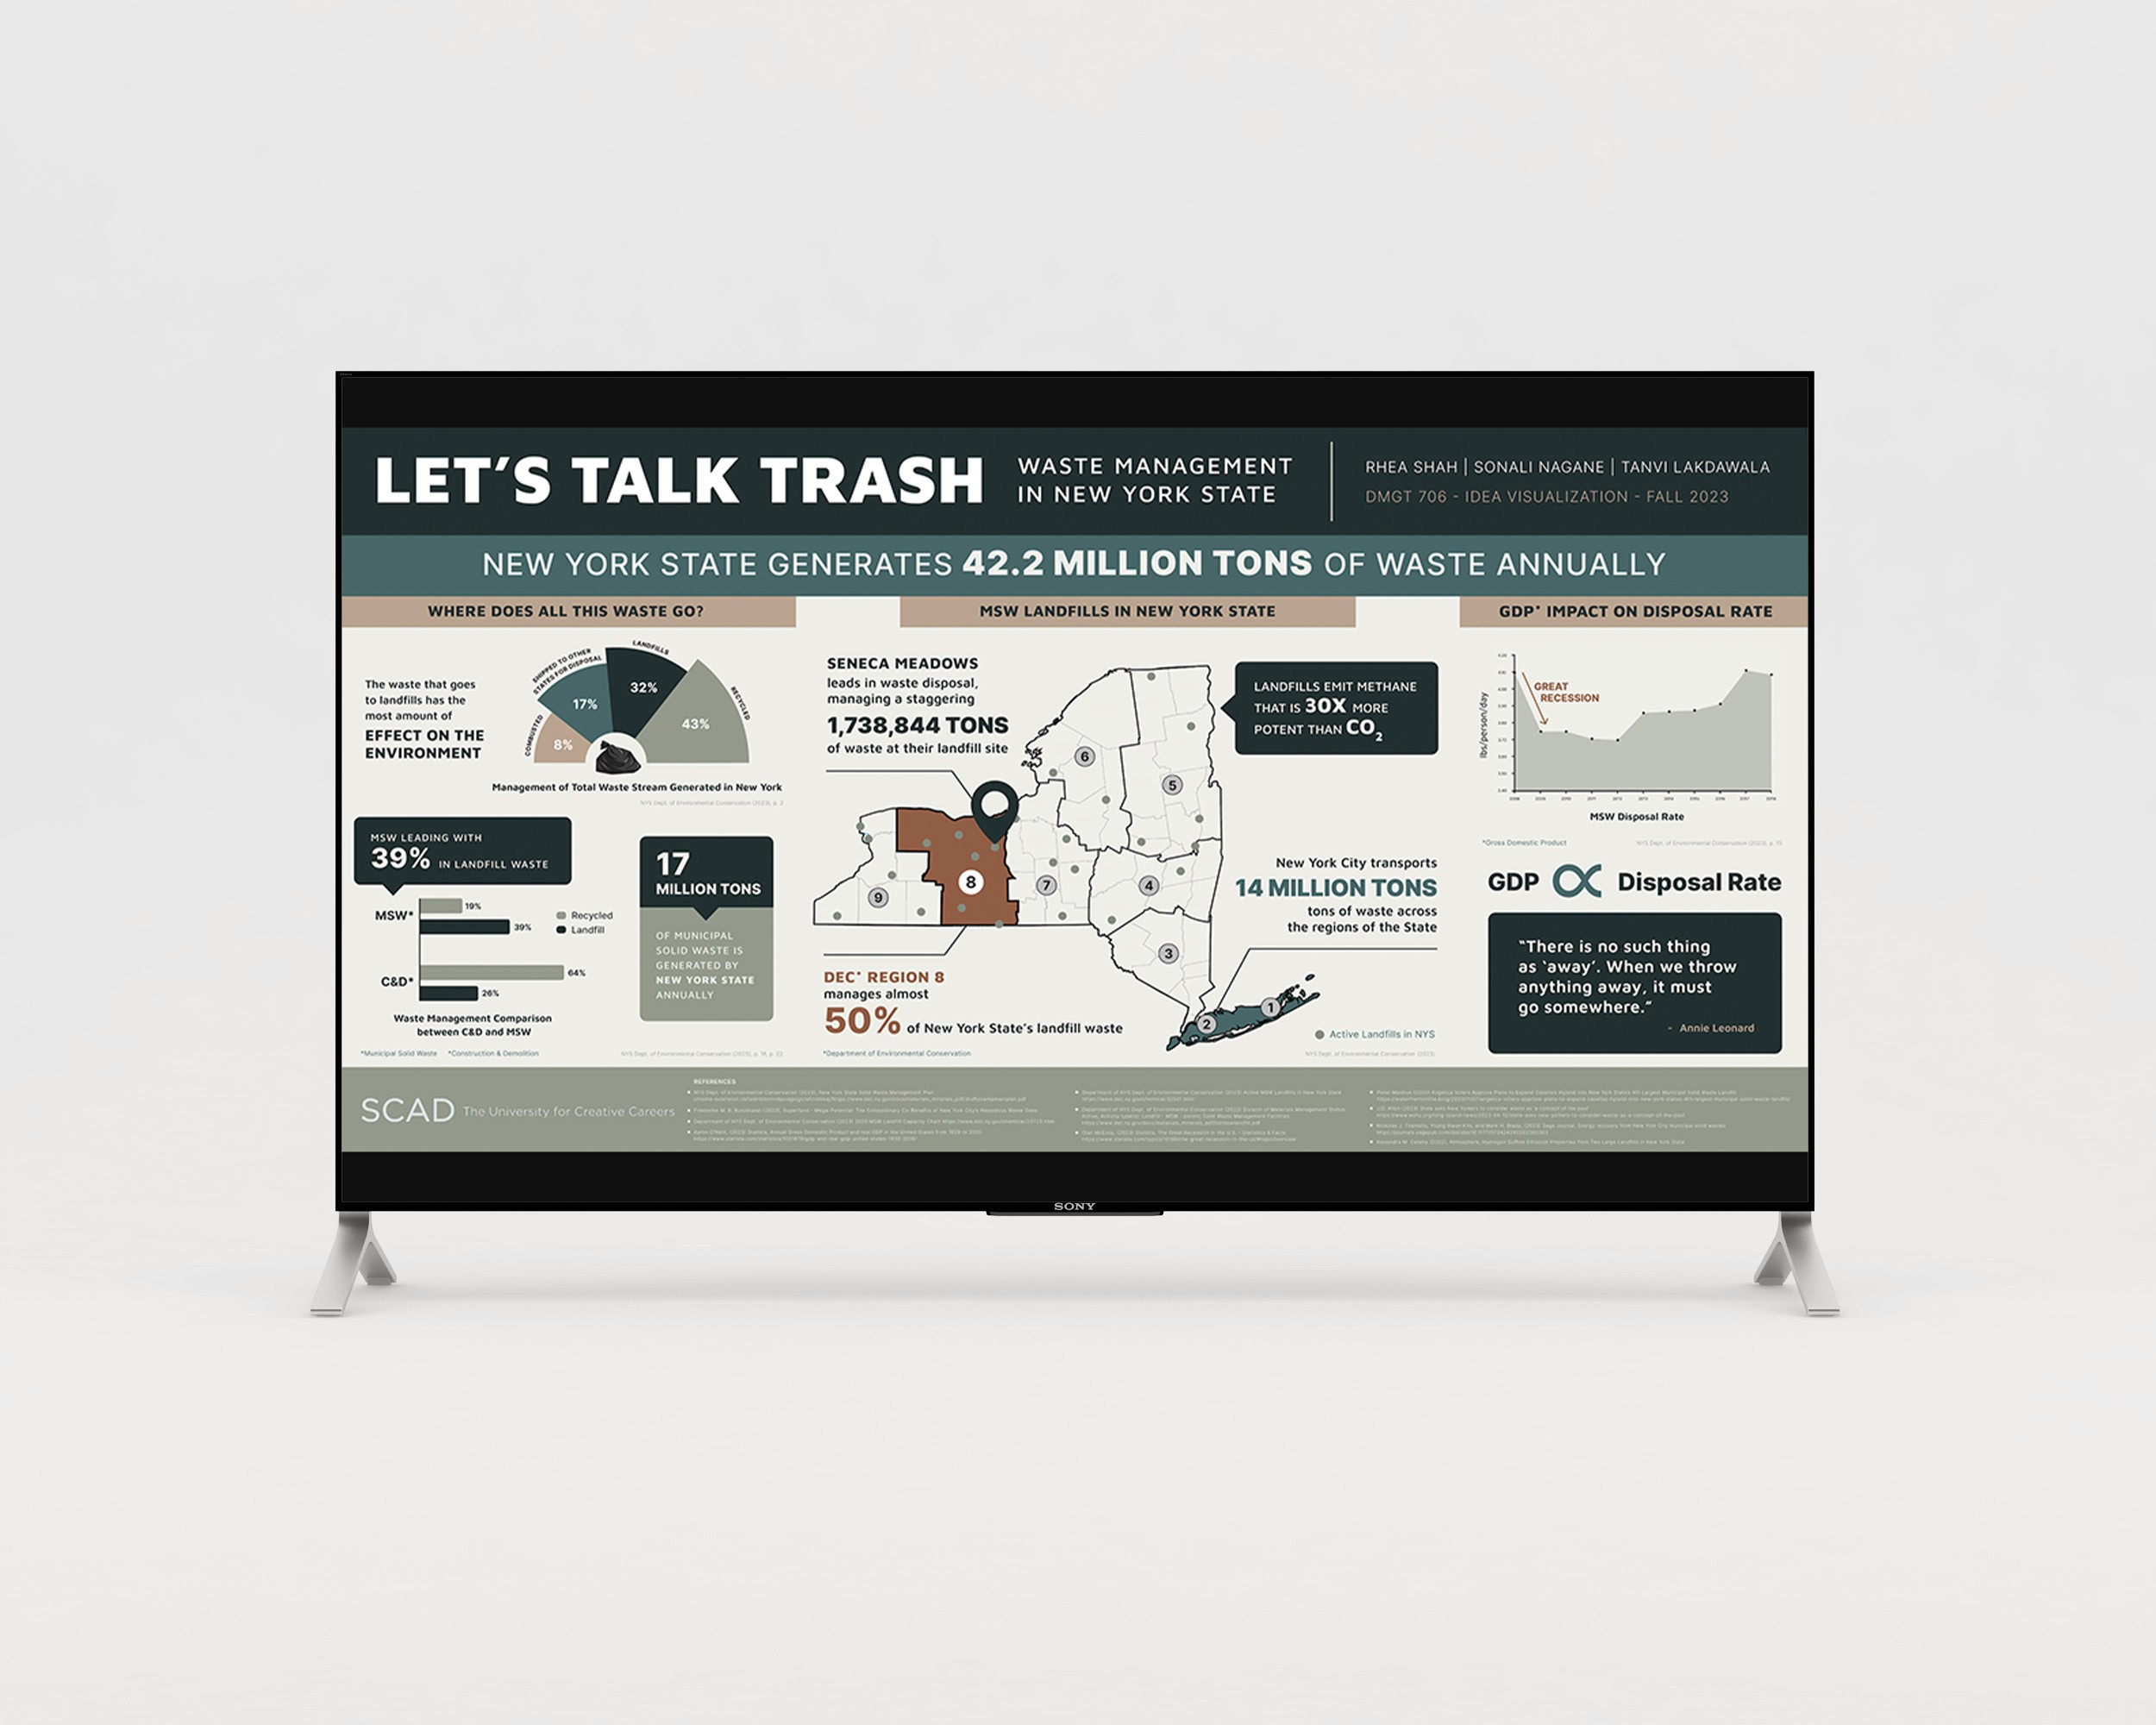
Digital poster
In alignment with the conference poster, the digital poster was crafted leveraging derived data and insights.
This collateral was purposefully tailored for large-scale displays, with a focus on mastering narrative coherence across diverse mediums.
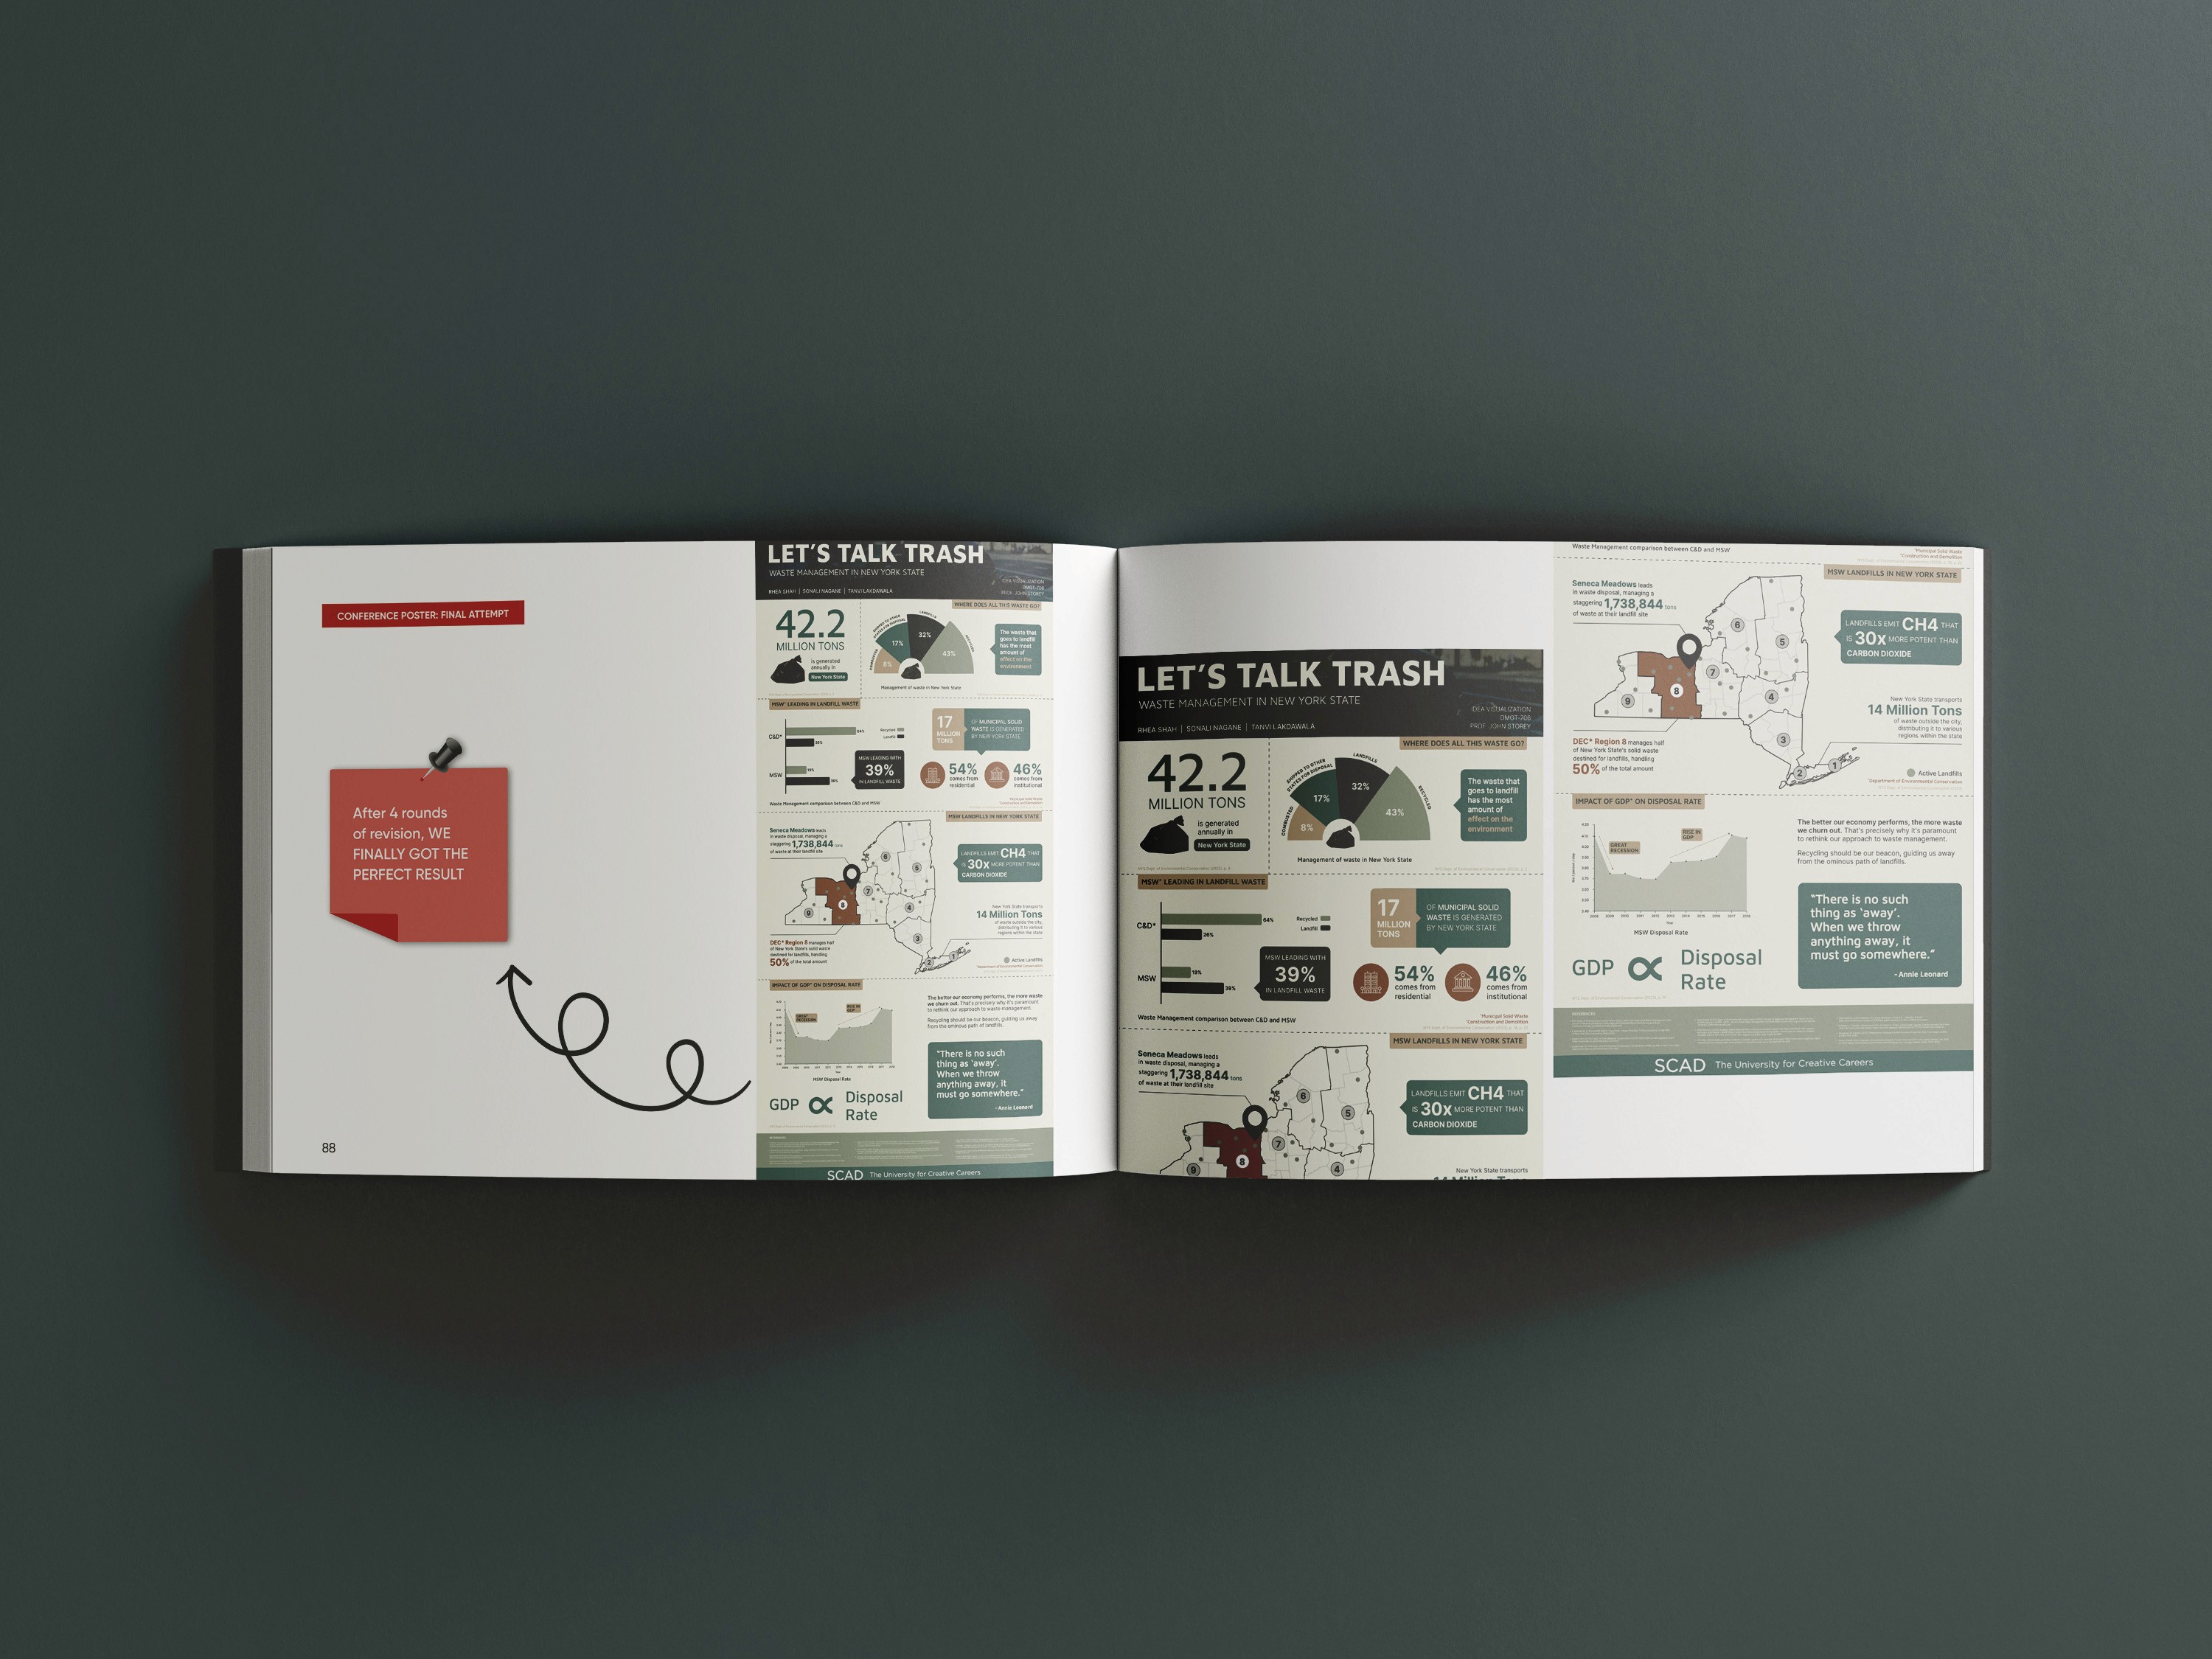
The process book
The comprehensive documentation of the project has been compiled within a process book, including the iterative stages, thorough research findings, and the culmination of final outcomes across diverse mediums.

©2025 by Tanvi Lakdawala. All rights reserved.